This training needs analysis presents the survey results of use of digital technologies in VET, in Dig4VET partner countries Latvia, Lithuania and Portugal. The particular focus is on digital competences of VET teachers, trainers, WBL tutors/mentors in the field of education technologies. The need analysis includes their perceptions about their digital competences. It comprises their understanding of the potential of digital tools in learning, teaching, assessment, validation, awareness of digital policies and their perception of training needs. Consistently, it includes the perceptions of VET students and VET school managers. The need analysis also covers an overview of digital tools, education technologies and apps relevant and useful for VET and WBL settings. As well, it offers an overview of how VET schools, VET teachers and school leaders in partner countries were prepared and how they succeeded during the time of Covid-19 pandemic outbreak.
Implementation of the Needs Analysis
To explore the digital competences of VET teachers, trainers, tutors, mentors, and students in three the Dig4VET projects’ European countries, this analysis used principally data gathered by the SELFIE (see Self-reflection on Effective Learning by Fostering Innovation through Educational technology). SELFIE is a self-reflection tool that is launched, developed, and administered by the European Commission. This methodological choice was made with the intent to reach equal data with trustworthy and earlier standardised instruments. Additionally, we used a tailored Survey of tools questionnaire and collected qualitative data from the project participants.
This chapter describes the implementation of the need analysis in more detail. It explains the aims of the needs analysis, study context, participants and methods of data collection and analysis. Finally, the main results and conclusion of the results are presented.
Aims
The main aim of the need analysis was to gain overview of VET teachers’, tutors, mentors’, school leaders’ and students’ perceptions of their digital competency and use of digital technology in Dig4VET partner countries’ organisations (VET schools). As well, it intented to report about the use of SELFIE tool for a need analysis purpose. As the SELFIE tool survey was conducted during the Covid-19 pandemic time (2020-2021), at the same time it covers an overview on VET distance and digital learning during the virus outbreak. This report also gives an overview of digital tools and technologies available for use in VET and WBL teaching and learning.
On the grounds of the conducted surveys, one important practical aim was to get a quick and up-to-date overview of the participating organisations’ staff’s digital competences, to develop a joint training programme for a group of VET school teachers during this project. The teachers were intended to be trained during the project in two joint staff training periods. After the training teachers were expected to implement the skills learned to the national level in their own organisations. For example, after the training VET schools’ teachers were asked to provide examples of using digital tools in their different vocational fields and organised master classes at their schools.
Study Context
The needs analysis includes results of SELFIE survey reviews in three partner countries: Latvia, Lithuania and Portugal. The partner VET school organisations from these countries formed the main piloting ground and presented the focus groups in Dig4VET training. The VET schools from Latvia (Rīgas Mākslas un Mediju tehnikums), Lithuania (Vilnius Car Mechanics and Business School) and Portugal (ETAP – Escola Profissional) represented different VET programs and carried out their self-evaluation with SELFIE tool. According to the focus groups categorised in SELFIE tool, they conducted the SELFIE based needs analysis from the perspective of three profiles: VET teachers, school leaders and students. In the VET teachers profile the participants are comprehended to represent also VET tutors, trainers or mentors. All the profiles shared their existing experience in use of digital tools, as well as their experience and results of the period of distance/digital learning during the COVID-19 pandemic in spring 2020.
Methods and Data Collection
The needs analysis survey was conducted between the end of December 2020 – February 2021. The data were collected mainly via SELFIE tool and additionally by a tailored Survey of tools questionnaire. During the project there were also collected some qualitative data, such as free feedback from the use of the surveys and training. The Finnish partners led all the need analysis and SELFIE surveys and the Dig4VET project staff from Latvia, Lithuania and Portugal provided the practical survey procedures in their own countries. The project staff prepared the local SELFIE questionnaire to include the same question patterns and additional questions as jointly decided in the Dig4VET-project with the aid of Finnish partners. The project staff in each three countries conducted the surveys and collected the SELFIE reports in their participating vocational school organisations and sent the SELFIE school reports in pdf-format to the Finnish partners for the further need analysis.
SELFIE – Self-Reflection Tool on Effective Learning
The need analysis was primarily based on the SELFIE questionnaire. SELFIE, a self-reflection tool for schools’ digital capacity, is based on the European commissions’ DigCompOrg framework (see https://education.ec.europa.eu/selfie). SELFIE helps schools systematically exploit and reflect the opportunities that digital technologies can offer for them. SELFIE enables the school community to reflect their current digital capacity collectively. It focuses on improving students, professionals and organisational learning. It also provides a common and consistent language for discussion, development and implementation of policies and practices at the European level (Bocconi, Panesi & Panagiotis, 2020).
SELFIE is easy to conduct online and available on the European Comissions’ website for free in all EU official languages (see https://education.ec.europa.eu/selfie). The views of teachers school leaders and students are gathered by using short statements and questions with a simple 1-5 answer scale. It takes approximately 20 minutes to complete the survey. Every school can also customise the tool to suit their unique needs. Schools can select and add questions and statements that match the needs and context of their school. Each school that provides the SELFIE-questionnaire receives a detailed, tailor-made and visualised report (called the SELFIE School Report). The SELFIE assessment could also be provided periodically to help the school to gauge their progress.
SELFIE gathers the answers anonymously and data is secure. The data is for the school only, no personal data is collected. It is not possible for other organisations to track the answers for an individual school or participant. Each school owns its’ SELFIE report, which is not shared with others unless the school chooses to do so. SELFIE is hosted on a server owned and managed by the European Commission. All the data is gathered according to the Commission’s data processing rules and rules for SELFIES’s data and privacy (see https://education.ec.europa.eu/selfie/data-and-privacy).
SELFIE has a strong basis in research on promoting effective digital-age learning (Kampylis, Punie & Devine, 2015). School leaders, teachers, students, policy makers from across Europe have been developing and researchers have also validated it (Castaño-Munoz, Costa, Hippe, & Kampylis, 2018; Costa, Castaño-Munoz, & Kampylis, 2020). 5 000 staff and students have given input to the early design of the tool, 67 000 people from 650 schools across Europe (Belgium, Cyprus, Denmark, Estonia, Finland, Greece, Ireland, Italy, Malta, Spain, UK, and Georgia, Russia and Serbia) took part in the pilot test in 2017. Today it has been used by over 22 000 schools in 87 countries (see the continuously updated information on https://schools-go-digital.jrc.ec.europa.eu/).
Tailored SELFIE Questionnaire for Dig4VET
Overall, the SELFIE tool used in this need analysis survey included 57 existing items, and 10 tailored additional items. The existing SELFIE tool items focus on digital competences in eight theme areas that are presented in more details next.
A) Leadership
Items in leadership area concern: digital strategy, strategy development with teachers, new ways of teaching, time to explore digital teaching, copyright and licensing rules, involving companies in strategy. (e.g. “In our school, I have time to explore how to improve teaching with digital technologies.”)
B) Collaboration and networking
Items in collaboration and networking area include: progress review, discussion on the use of technology, partnership, synergies for remote teaching and learning. (e.g. “In our school, we collaborate with other schools or organisations to support the use of digital technologies.”)
C) Infrastructure and equipment
Items in the infrastructure and equipment area include: infrastructure supports, digital devices to use for teaching, internet access, technical support, data protection, digital devices for learning, devices for students. It also includes items about measures to identify challenges and support to address challenges, and items about bring your own device use, physical spaces, assistive technologies, online libraries/repositories and database of training opportunities. (e.g. “In our school, there are school owned and managed portable devices that students can take home when needed.” or “ In our school, students have access to a database of in-company training opportunities.”)
D) Continuing professional development
Continuing professional development (CPD) area comprises items in: CPD needs, participation in CPD, sharing experiences, CPD opportunities (e.g. “Our teachers have opportunities to participate in CPD for teaching and learning with digital technologies.”)
E) Pedagogy: supports and resources
This pedagogy area focus on supports and resources, and includes items in: online educational resources, creating digital resources, using virtual learning environments, communicating with the school community, open educational resources (e.g. “Our teachers use virtual learning environments with students.” or “Our teachers create digital resources to support their teaching.”)
F) Pedagogy: implementation in the classroom
The pedagogy area called implementation in the classroom area has items of concern: tailoring to students’ needs in school, fostering creativity, engaging students, student collaboration, cross-curricular projects and career guidance. (e.g. “Our teachers use digital technologies to tailor their teaching to students’ individual needs.” or “Our teachers engage students in using digital technologies for cross-curricular projects.”)
G) Assessment practices and assessing skills
Assessment practices and assessing skills area concludes items in: timely feedback, self-reflection on learning, feedback to other students, digital assessment, documenting learning, using data to improve learning and valuing skills developed outside school. (e.g. “Our teachers use digital technologies to enable students to reflect on their own learning in our school.” or “Our teachers use digital technologies to enable students to provide feedback on other students’ work.”)
H) Student digital competences
Student digital competences area items comprise: safe behaviour, responsible behaviour, checking quality of information, giving credit to others’ work, creating digital content, creating digital content, digital skills across subjects, learning coding or programming and learning to solve technical problems. (e.g. “In our school, students learn coding or programming.”)
Additional Custom Questions
In Dig4VET-project, the tailored 10 additional questions focus on work-based settings. The items included questions about: 1) computers or mobile devices to use, 2) WBL tutors use digital technologies for teaching/supervision, 3) WBL tutors use digital technologies for guidance and to interact with learners, 4 ) WBL tutors use digital technologies to teach skills, 5) WBL tutors instruct students to use digital technologies to document their expertise and competences achieved, 6) WBL tutors use digital technologies for assessment and to provide feedback, 7) Teachers enable students to use digital technologies used in working life, 8) Digital technologies have helped to develop guidance partnership with working life, 9) Students use of digital technologies to plan and monitor their own learning, 10) Digital technologies have supported students in achieving learning objectives during the pandemic.
Survey of Tools Questionnaire
To gain more detailed information about the digital technology tools that school personnel in DIG4VET partner countries’ (in VET organisations) use, we tailored a Survey of tools questionnaire. It included questions about tools and applications the VET schools use. For example the participants were asked to choose the tools they use in their workplace from the list of technological equipments (e.g. portable laptop, tablet, smartphone, 360 camera, 3Dprinter, virtual reality technology, simulation technology), Cloud services (e.g. Google Drive, DropBox, OneDrive), social media applications (e.g. Facebook, LinkedIn, Instagram, Youtube, Google Drive, One Drive, WhatsApp) or Online platform for teaching/counselling (e.g. Zoom, Teams, Skype, Google Hangout, Meet, Adobe Connect). There were altogether 29 items about technologies, applications or other digital learning tools in this survey.
Data Analysis
The main analysis is based on SELFIE School Reports that the SELFIE tool provides. The average numbers were found the most appropriate way to collect results together from the returned SELFIE reports. There was no access to the original SELFIE School Reports database due to make further and more detailed quantitative analysis (without bias). Respondents in SELFIE used five-point scale averages, ranging from low (1) to high (5). The emphasis in analysis was in high ratings (strengths), low ratings (weaknesses) and notable ranges between values. As instructed by the EC’s Selfie team, SELFIE is not meant to compare schools (see https://education.ec.europa.eu/selfie/resources). To honour this guideline, the data is not presented by schools or countries and there are no comparisons made between schools and countries in this analysis. Yet, some single figures are chosen to demonstrate the analysis process and present examples of how averages were gathered together by the countries.
Due to help to interpret and discuss average values in a more detailed manner, a modified DigCompEdu frameworks’ proficiency level scale was implemented to assist the analysis of the SELFIE results for this need analysis purpose. (see Figure 4) (see https://ec.europa.eu/jrc/en/digcompedu/framework/proficiency-levels).

Results
Participants
Altogether 219 respondents participated in the SELFIE study (Latvia n = 124, Lithuania n = 63, Portugal n = 32). There were 13 leaders, 47 teachers and 159 students who took part in the SELFIE survey (see Figure 5). The response rates were Latvia 57.7 % (N= 215), Lithuania 78.8 % (N=80), Portugal 20.4 %, N=157). Additionally 83 participants took part in Survey of tools -survey (Latvia n = 27, Lithuania n = 44, Portugal n = 12).

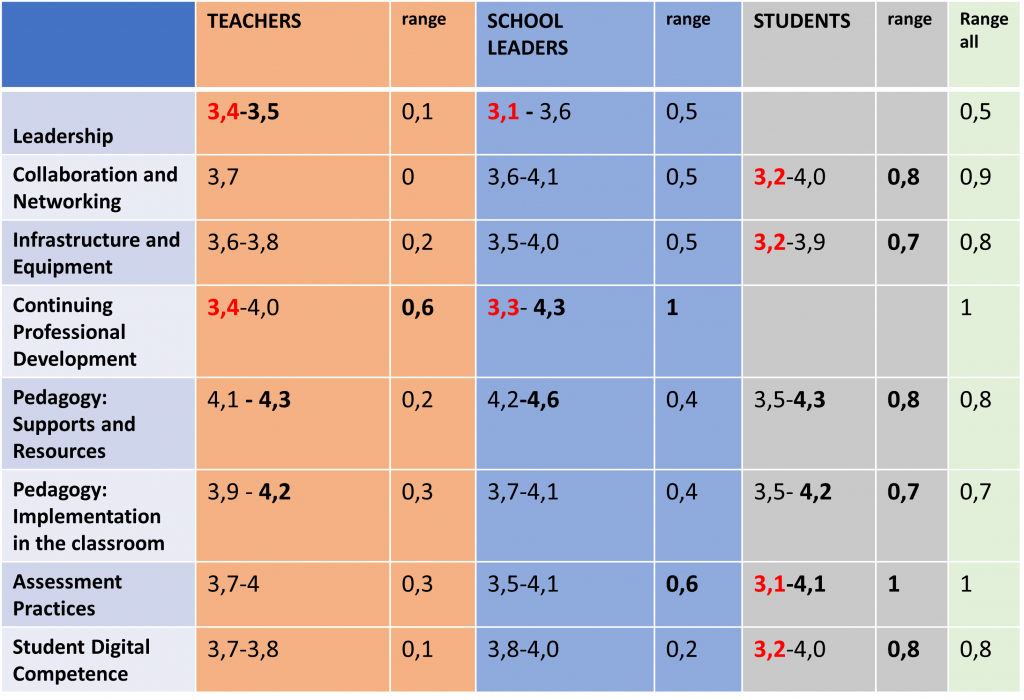
Overall the results indicated that on average all profiles showed at least good or moderate (3.1–4.6) competence levels in all digital competency areas (see Figure 6). In general results showed that the high competence levels were gained especially in pedagogy: supports and resources -area (3.5–4.6). Overall the lowest competences showed up in leadership (3.1–3.6). It is important to bear in mind that all in all there did not emerge any remarkably low competence levels in any assessed area of the competence. However, the more detailed analysis revealed some fine-grained differences and also similarities between profiles and competence areas.
School Leaders
In general school leaders reported the most skillful competences in pedagogy: supports and resources (4.2–4.6) and lowest levels in leadership (3.1–3.6) (See Figures 6 and 7). They assessed the strengths in their organisation were in implementing new ways of teaching, discussion on the use of technology and organising devices and tailoring education to students’ needs in school. They reported rather high levels in using virtual learning environments and open online educational resources.
As weaknesses they experienced at first that they do not have enough time to explore digital teaching methods and technologies. They experienced needing more digital skills in planning their digital strategy and involving companies in strategy planning and also using more synergies for remote teaching and learning. They were looking for more databases of training opportunities and participation in continuing professional education. However, the range between school leaders’ assessment of their CPD was rather high (3.3–4.3) (see Figures 6 and 9). School leaders also experienced somewhat lower levels in how they utilise self-reflection in learning, feedback to other students and cross-curricular projects.

Teachers
Similarly as school leaders, teachers showed the highest competences in pedagogy: supports and resources area (4.1–4.3) (Figures 6 and 8). They were most competent in utilising online and open educational resources and communicating digitally with the school community. They experienced that they were capable in using virtual learning environments and utilising internet access. Teachers assessed also as strengths how they know copyright and licensing rules. They reported their competence levels high in discussion on the use of technology and valuing students skills that they have developed outside the school.

Teachers estimated the lowest competence in continuing professional development (CPD) (3.4–4) and leadership (3.4–3.5) (see Figures 6, 7 and 9). For example, they found it more difficult or had a lack of opportunities to participate in CPD concerning teaching and learning with digital technologies. Teachers showed willingness in sharing their teaching experiences in continuing professional development training, but teachers looked for more possibilities to discuss their needs for teaching with digital technologies. As weaknesses teachers reported also how they do not optimally use synergies for remote teaching and learning and how their school is lacking for devices for students. They also found that they don’t have enough time to explore digital teaching or create digital resources.
In implementing pedagogy in the classroom teachers (also school leaders) assessed that implementing crosscurricular projects was more difficult than for example fostering students creativity, engaging students, utilising student collaboration or tailoring pedagogy and career guidance to students’ needs.

Students
In general students reported also the highest competences in pedagogy: supports and resources area (3.5–4.3) (e.g. using virtual learning environments with students) (see Figures 6 and 8). Students experienced as their strengths how they can use digital skills across subjects and in cross-curricular projects. They also experienced good competence in using virtual learning environments and having digital devices. They reported high levels in using technology in student collaboration and having discussions about the use of technology.
Students experienced the lowest scores in assessment practices (3.1–4.1), however the range was rather big (see Figures 6 and 10). The assessment practices area relates to measures that schools may consider in order to gradually shift the balance from traditional assessment towards a more comprehensive repertoire of practices. This repertoire could include technology-enabled assessment practices that are student-centred, personalised and authentic. In assessment practices (all profiles) experienced weaker skills especially in how digital technologies were utilised to enable giving feedback to other students.
All profiles, students, school leaders and teachers reported that there weren’t always appropriate facilities or devices (e.g. portable) for students to use. Students’ and school leaders reported also that the databases of digital training opportunities were sometimes rather poor. The internet access was not a problem for any profiles.

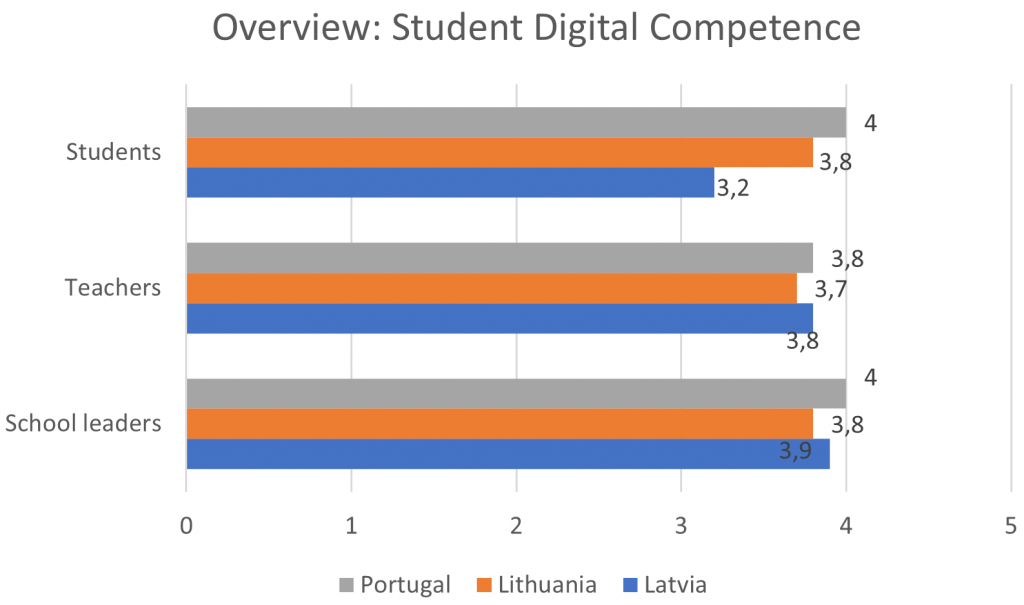
By all profiles, students’ digital competences (see Figure 11) were found to be good in responsible behaviour, creating digital content, and showing skills for vocational qualification. Students were found skillful in using digital skills across different subjects and in communicating. In all profiles, lower skill levels were reported in students’ possibilities to learn coding or programming and learn to solve technical problems.
Work-Based Settings
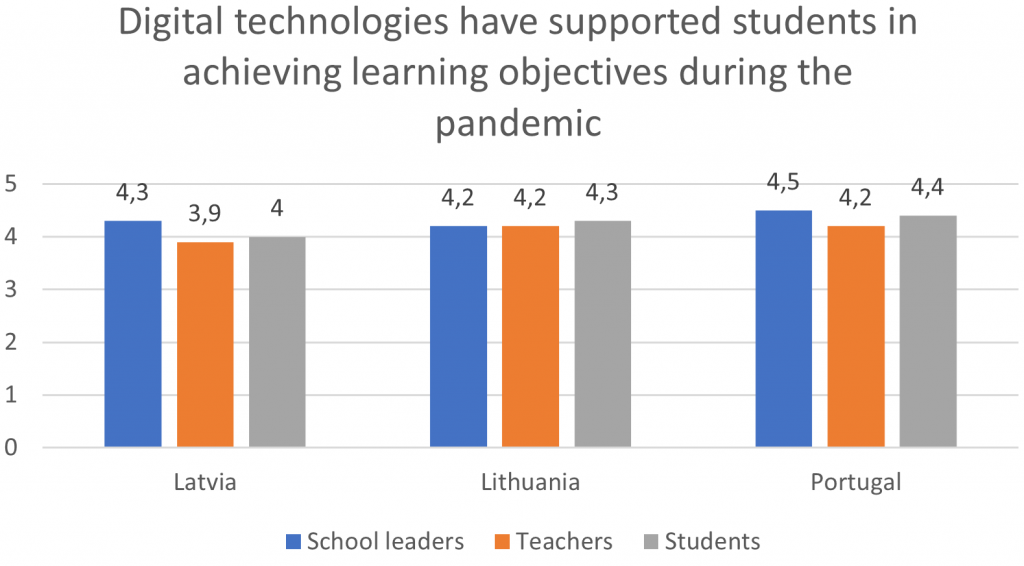
In work-based settings teachers and school leaders reported best abilities in how WBL tutors use digital technologies for guidance and to interact with learners. It was also highly skilled how WBL tutors use digital technologies to teach skills, instruct students to use digital technologies to document their expertise and competences achieved. In-line, teachers enabled students to practise technologies that are used in working life. What was an obvious result is that all profiles agreed that digital technologies have supported students a lot in achieving learning objectives during the pandemic (Figure 12). Also, both teachers and school leaders reported to find more synergies for remote teaching and learning with other schools and organisations.
Only slightly weaker skills were reported in the experiences of how digital technologies have helped to develop guidance partnership with working life, and how students use digital technologies to plan and monitor their own learning. As well, the students’ possibility to have computers or mobile devices to use in WBL settings was somehow weaker. In addition, students stated that WBL tutors do not often instruct students to use digital technologies (e.g. ePortfolios, learners’ blogs) to document their expertise and competences achieved.
Study of Tools Results
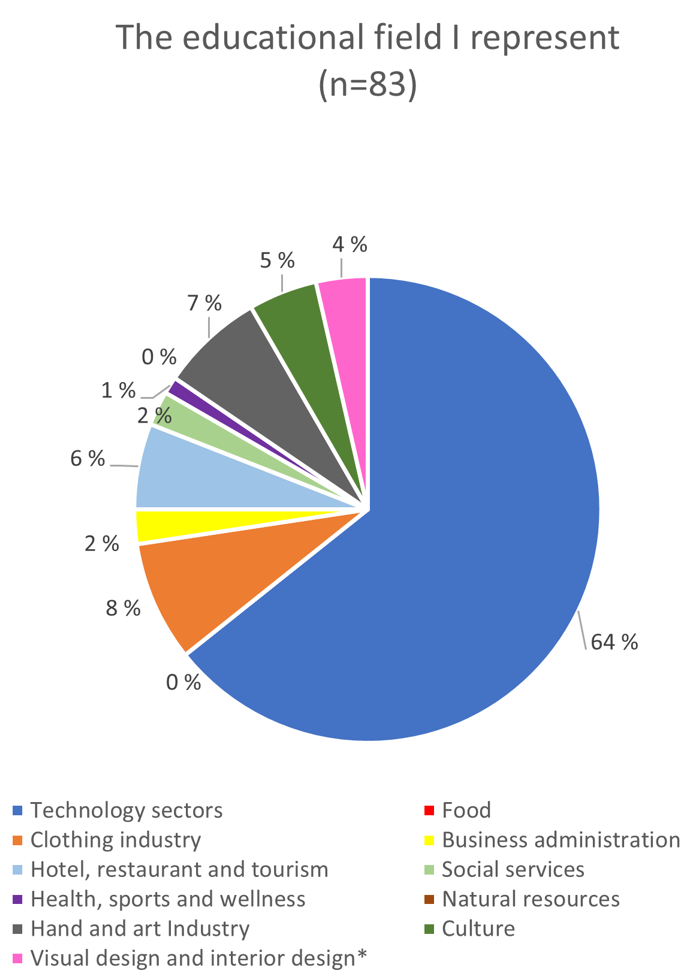
Altogether 83 participants took part in Survey of tools -survey (Latvia n = 27, Lithuania n = 44, Portugal n = 12). 64 % of them represented technology sectors, 8 % clothing industry and 7 % hand and art industry (see Figure 13).
The results of this study revealed that the most used tools and apps they had and used were online platforms for teaching/counselling (89 %) (e.g. Teams, Zoom), own smartphones (81 %), digital learning environments (80 %), YouTube (80 %), desktop computers from workplace (75 %) and cloud services (7 %) (e.g. Google Drive) and Facebook (74 %) (see Table 2).
| Yes when ever I need | No, but I would need |
| Online platform for teaching/counselling (89 %) | Tablet from workplace (45 %) |
| Own smartphone (81 %) | Simulation technology (38 %) |
| Digital learning environment (80 %) | Photo editor facility (33 %) |
| YouTube (80 %) | 3D-printer (32 %) |
| Desktop computer from workplace (75 %) | Virtual reality technology (30 %) |
| Cloud services (74 %) | A portable laptop from workplace (28 %) |
| Facebook (74 %) | Other 3D-technology (28 %) |
| Own desktop or laptop (72 %) | 360 camera (23 %) |
| Intranet (70 %) | Smartphone from workplace (27 %) |
| Student register database (57 %) | Simulator (27 %) |
| Mobile apps for teaching/counselling (54 %) | Videocamera (23 %) |
| A portable laptop from workplace (51 %) | Camera (23 %) |
| Own tabler (22 %) | |
| Wearable technology (21 %) |
What participants needed most, but didn’t have were tablets from the workplace (45 %), simulation technology (38 %), photo editor facilities (33 %), 3D-printers (32 %) and virtual reality technology (30 %). A synopsis of all the most important tools and applications that participants had proficiently in their use (Yes, when ever I need), or on the other hand, what they would need more (No, but I would need), is presented in table 2.
Supplementary Qualitative Results
During the joint Dig4VET project meetings and training periods the project staff and participating teachers were asked to write free feedback (Padlet) about the conducted SELFIE survey (N=8) and their professional development during digital pedagogical training (N=24). In qualitative feedback the SELFIE was considered good in layout and structure. Most of the participants would recommend the use of SELFIE to a colleague very likely or somewhat likely. On a scale from 4 to 10 they would on average give a grade of 8.5. SELFIE was regarded as well understandable. However, participants would add more flexibility in how to make changes when tailoring the questionnaire’s additional questions and amendments. What else they would improve in SELFIE, were propositions about updating the SELFIE with new approaches, methods and solutions (e.g. specify pandemic time). Participants also found that there should be a shortened version of the SELFIE and the filling instructions should be simplified. (Participant: “Instructions were complicated and too long.”)
Typically the Dig4VET professional digital pedagogical training was found to improve understanding about the framework of digital competences. In general participants experienced that it helped to improve their professional development, practical skills of using digital tools for teaching, learning, management and collaboration. For instance they had learnt about different kinds of interactive quiz tools and co-working platforms (e.g. Kahoot, Lucid charts, Quizizz, Socrative, Menti, Miro, Canva, Slido). The training was found partly interactive, however the participants were suggesting more collaboration and teamwork with others during the training. They wished for deep pedagogical reasoning and teamwork on the topics each participant was interested in. Participants also wanted to have more indepth demonstrations of digital teaching methods and platforms to use in tutoring the learning processes.
In particular, participants found it interesting and useful to learn about how to build and develop assessing and validation in VET schools with Digital Open Badges. From a side of the finnish educators, the Dig4VET digital pedagogical training included also a tailored Open Badge, called “Self-Assessment of Digital Pedagogical Competence” (see Figure 14).
It was voluntary for participants to exhibit their gained digital pedagogical competence during the training, apply and gain a digital Open Badge for it. According to the evaluated digital Badges participants perceived that they had improved their digital skills and confidence in using digital tools. They described they have had time to explore digital pedagogy during the training. They were especially pleased with how they had learnt to engage students in learning and make lessons pedagogically more interesting and motivating with the aid of technology.
Summary of the Needs Analysis
The need analysis was conducted in the beginning of the year 2021, during the Covid -19 pandemic outbreak. The aim of the need analysis was to gain overview of school leaders’, teachers’ and students’ perceptions of their digital competence and use of digital technology in participating organisations, in three countries: Latvia, Lithuania and Portugal. The SELFIE provided essential data for need analysis and the data were collected mainly via SELFIE tool that is run by the European commission. In general, the findings showed positive signals about VET teachers’, trainers’, tutors and mentors’ digital pedagogical skills, use of the technology and online learning environments for teaching and existence of basic digital infrastructure in schools. They all obtained rather high scores, but some slightly weaker areas and things to develop were also revealed.
Overall school leaders reported the most skillful competences in pedagogy (supports and resources) and lowest levels in leadership area. They needed more digital skills especially in planning their digital strategy. In addition, they experienced that they do not have enough time to explore digital teaching methods and technologies. Similarly, teachers and students showed the highest competences in pedagogy area concerning supports and resources. They were most competent in utilising online and open educational resources, virtual learning environments and communicating digitally with the school community. Only the ability to create digital resources was found somehow more difficult. In implementing pedagogy in the classroom especially teachers and school leaders assessed that implementing cross-curricular projects was more difficult than for example implementing pedagogy to meet students’ needs. Teachers estimated the weakest competence in continuing professional education and leadership. For example, they found it difficult or had a lack of opportunities to participate in CPD about teaching and learning with digital technologies. They looked for more possibilities to discuss their particular needs for teaching with digital technologies. This confirms the similar findings that having possibilities (training, time, professional networks) to share experiences is seen as a key aspect for effective integration of digital technologies in teaching practices and to gain professional development (Castaño-Muñoz, Weikert Garcia et al., 2021).
In all profiles, students’ digital competences were found good in their responsible behaviour, creating digital content, showing skills for vocational qualification, using digital skills across different subjects and in communicating. Students’ and school leaders reported that the databases about digital training opportunities was their weakness area. All profiles also reported that there weren’t always appropriate facilities (e.g., devices) at school for students to use. Challenges were also reported in students’ possibilities to learn coding or programming and to learn to solve technical problems.
Noteworthy, by students, the lowest levels were reported in assessment practices. This related to technology enabled assessment practices that should be student-centred, personalised, and authentic and how digital technologies could be utilised to give feedback to other students. In line with earlier SELFIE studies (Castaño-Muñoz & Weikert Garcia et al. 2021), this finding highlights the still existing concern or lack of collaborative and student-centred uses of digital technologies and their application in innovative assessment procedures. To promote this, teachers, tutors and mentors should consciously enhance students’ self-regulated learning skills (e.g., motivation regulation) which are regarded as integral, particularly in digital learning environments (Mäenpää, 2021).
In work-based learning settings, WBL tutors appeared to use digital technologies for guidance smoothly and to interact with learners well. WBL tutors use digital technologies to teach skills and enable students to practise digital technologies used in working life. Some challenges were reported in how digital technologies were utilised to create partnership with working life, to plan, monitor and assess students’ own learning or to document their expertise and competences achieved (e.g., portfolios, learners’ blogs). All profiles agreed that digital technologies have massively supported students in achieving learning objectives during the pandemic.
SELFIE based need analysis provides a possibility to share ideas and discuss with different countries about their VET school’s digital capacity. However, it has some limitations too. On the grounds of the SELFIE reports it was difficult to display the data together with other organisations. Even if the SELFIE results are not meant to be compared it would be beneficial if the tool was able to collect the data together from several schools to a one anonymous report in joint projects like Dig4VET. A major limitation of the current study derives from the limited sample size of participants in all participating countries and a very restricted sample number of educational organisations. Despite the limitations, the need analysis sheds light on issues that should be addressed in developing the digital capacity and recommendations for vocational schools. It should be also noted that the report will cover only partner countries, but information gathering approaches can be continued regarding other EU countries.
References
Bocconi, S., Panesi, S. & Kampylis, P. 2020. Fostering the Digital Competence of Schools: Piloting SELFIE in the Italian Education Context. IEEE Revista Iberoamericana de Tecnologias del Aprendizaje 15 (4), 417–425. https://doi.org/10.1109/RITA.2020.3033228
Castaño-Muñoz, J., Costa, P., Hippe, R. & Kampylis, P. 2018. Within-school differences in the views on the use of digital technologies in Europe: evidence from the SELFIE tool. Edulearn18 Proceedings. https://doi.org/10.21125/edulearn.2018.2528
Castaño Muñoz, J., Weikert Garcia, L. & Herrero Rámila, C. 2021. Analysing the digital capacity of Spanish schools using SELFIE: an early diagnosis for a better response to COVID and beyond. Publications Office of the European Union, Luxembourg. https://data.europa.eu/doi/10.2760/947402
Costa, P., Castaño-Munoz, J. & Kampylis, P. 2020. Capturing schools’ digital capacity: Psychometric analyses of the selfie self-reflection tool. Computers & Education 162, 104080. https://doi.org/10.1016/j.compedu.2020.104080
Mäenpää, K. 2021. Motivation regulation and study well-being during nurse education studies. Doctoral dissertation. University of Oulu. http://urn.fi/urn:isbn:9789526231532

Vastaa
Sinun täytyy kirjautua sisään kommentoidaksesi.